Through Photoview manage spectrum data
Question: Do you need to manage spectrum for horticoltural applications with PAR units?
Solution: With Photoview you can and even run a horticoltural calculation with Litecalc directly in PAR units
About Photoview - Horti in LITESTAR 4D:
Photoview – Horti the Photoview section for the management of photometric and spectrum data in the horticultural field (400-700 nm) of luminaires and light sources used for increasing and improving plant growth.
The photometric and spectrometric data can be converted into, displayed as and printed as industry-typical graphics and charts.
The graphs and tables managed by Photoview - Horti are:
• spectrum graphs for the horticultural field
• spectrum graph and color plane according to the 3 typical configurations (CIE 1931 – CIE 1960 and CIE 1976)
• spectrum graph and evaluation chart of the various PAR parameters
• graphs for the McAdam analysis
• polar and cartesian diagrams
• 3D photometry visualization
• beam spread diagram
• isolux and isocandela curves
• technical data sheet
• custom graphics
Photoview - Horti features an option to color the graphs according to the color coordinates of the measured integral spectrum
Photoview spectral data processing function: visual range (380-780 nm)
spectrum display
Displays colored planes with colored dots according to CIE 1931 (x, y), CIE 1960 (u, v), CIE 1976 (u', v')
The product shunt is measured by Angle spectrometry
Values of CCT, D (uv), Delta (u'v'), CRI8 to Ra and CRI15, S/P (dark vision/light) and M/P (melanin/light) ratios according to different criteria
Histograms and CRI charts
McAdam chart (analyzing the color deviation of the same luminaire)
According to the IES TM-30-18 color grading table has the following characteristics:
Evaluation of Rf (fidelity) and Gg (color gamut) parameters
Color evaluation sample chart with 99 samples (fidelity depends on shading)
color distortion and color vector graphics
Rf diagram
Chromaticity shift chart
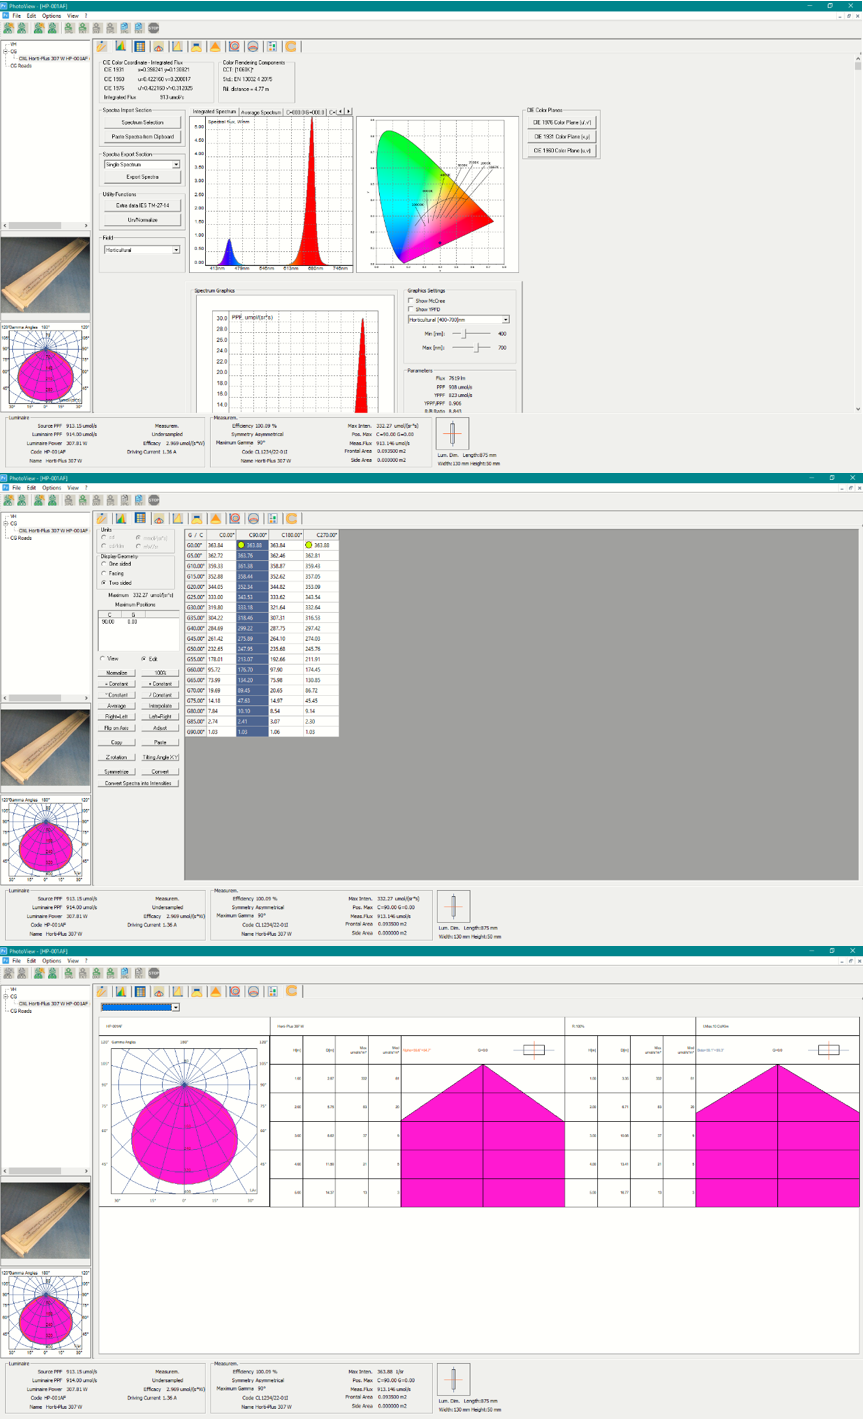
Plant lighting spectrum management: 400-700nm
spectrum display
Displays colored planes with colored dots according to CIE 1931 (x, y), CIE 1960 (u, v), CIE 1976 (u', v')
Integral measurement of PAR streams by angular spectrometry
color temperature
PAR unit spectrogram with band selector
PAR parameter table: PPF (photon flux for photon synthesis), YPPF, YPPF/PPF, R/B ratio
PPF/W efficacy
Sample Gallery:
Are you interested in further reading? Find more relevant use cases here:
|